Radon Info

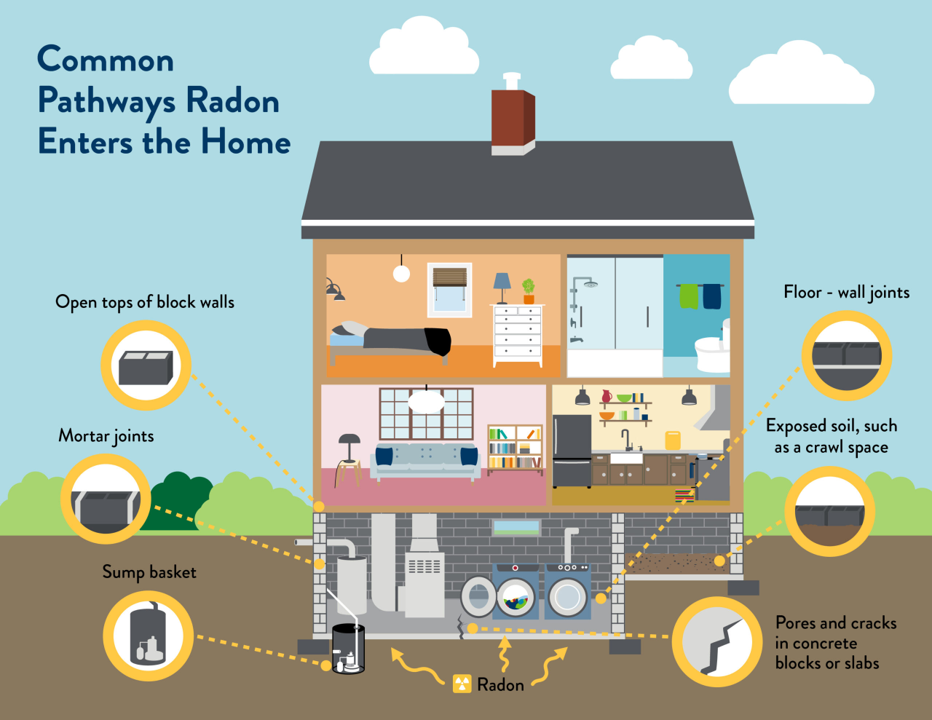
Diagram of a house showing how radon enters the home through open tops of block walls, mortar joints, floor-wall joints, exposed soil, and cracks in concrete blocks or slabs, with labels indicating common radon entry points.
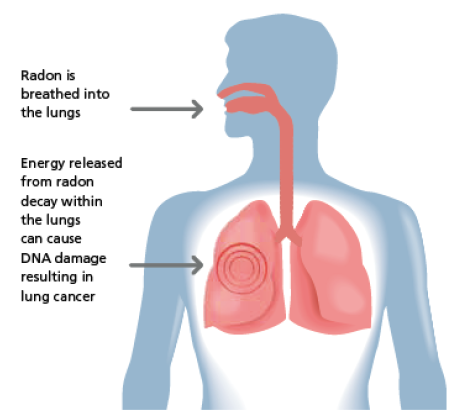
Diagram showing how radon is inhaled into the lungs and its potential to cause DNA damage leading to lung cancer.
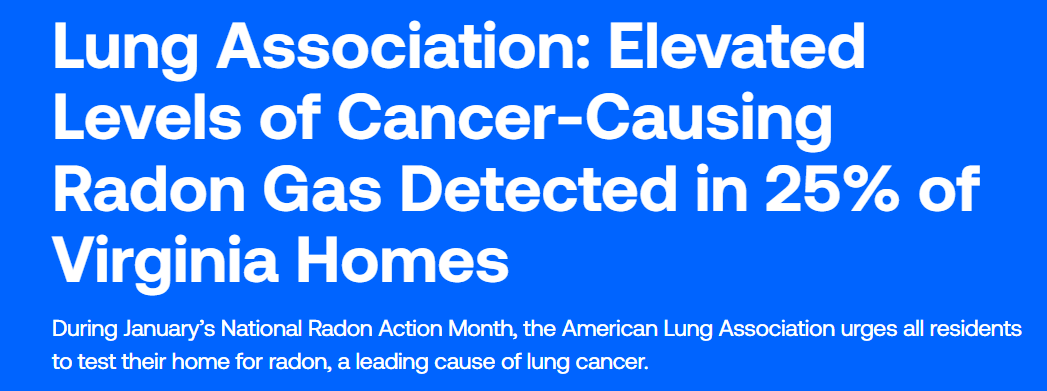
Blue background with white bold text that reads: "Lung Association: Elevated levels of cancer-causing radon gas detected in 25% of Virginia homes. During January's National Radon Action Month, the American Lung Association urges all residents to test their home for radon, a leading cause of lung cancer."
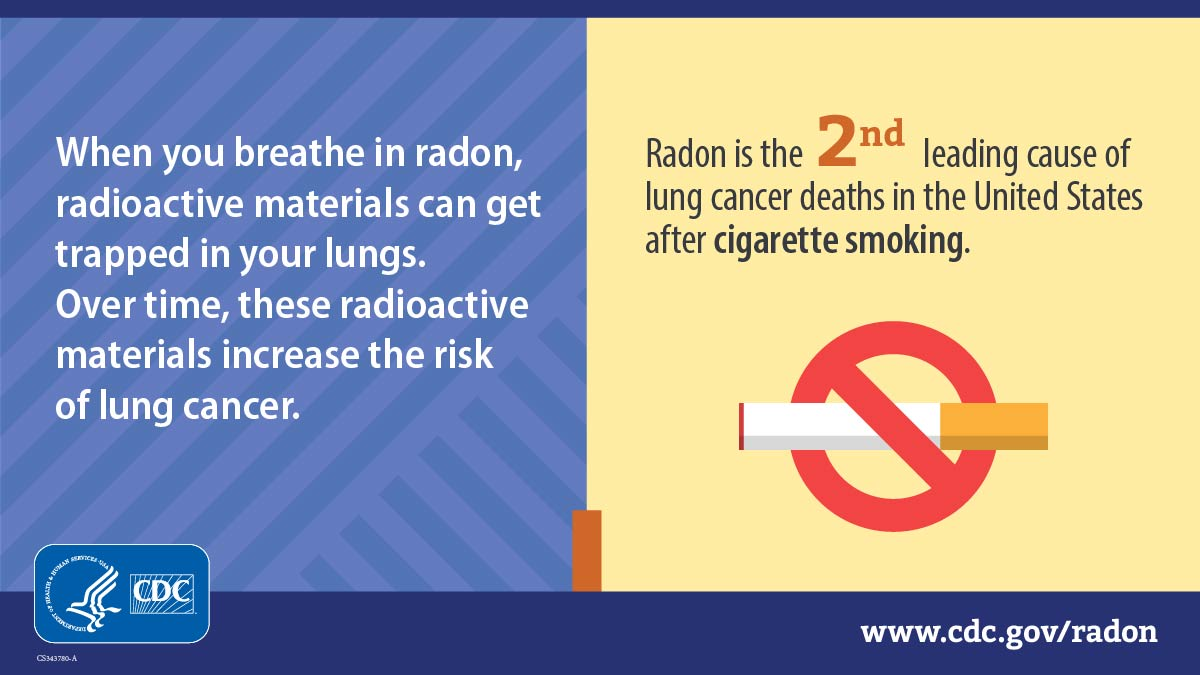
Infographic about radon risks. Left side: blue background with white text warning that breathing in radon can trap radioactive materials in lungs, increasing lung cancer risk. Right side: yellow background with text stating radon is the second leading cause of lung cancer deaths in the U.S. after smoking, accompanied by an illustration of a cigarette with a red prohibition sign. CDC logo and website at the bottom.
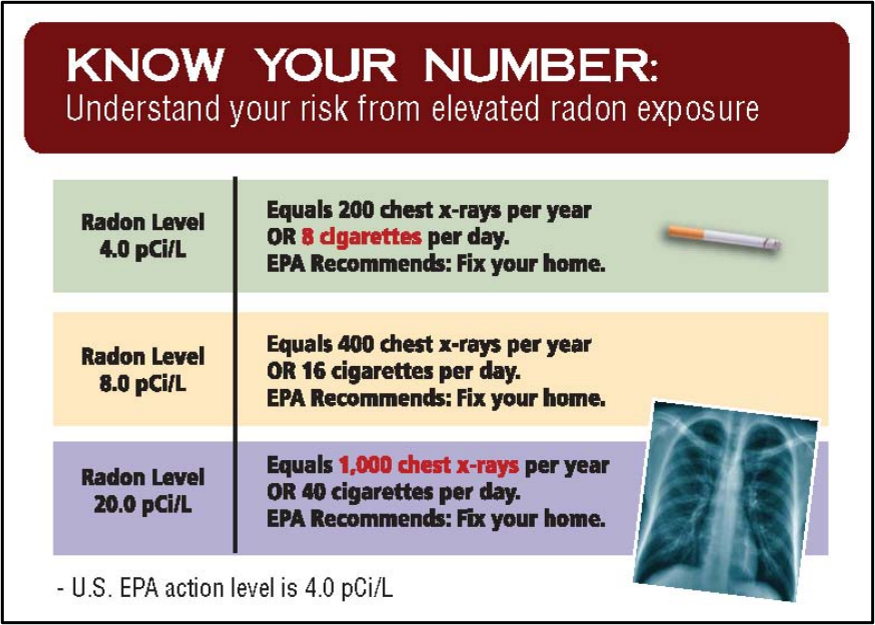
A chart showing radon exposure levels and associated risks. It includes three levels: 4.0 pCi/L, 8.0 pCi/L, and 20.0 pCi/L, with corresponding chest X-ray and cigarette equivalents, and recommendations to fix home. There is a small image of a cigarette and a chest X-ray of lungs.
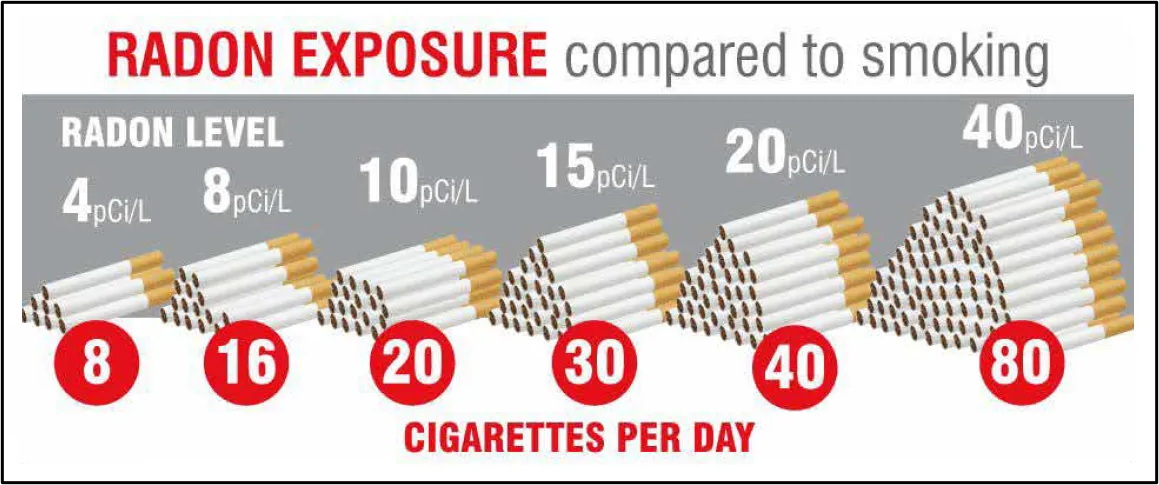
A chart comparing radon exposure levels to smoking, showing cigarette counts per day for various radon levels, from 8 cigarettes at 4 pCi/L to 80 cigarettes at 40 pCi/L.
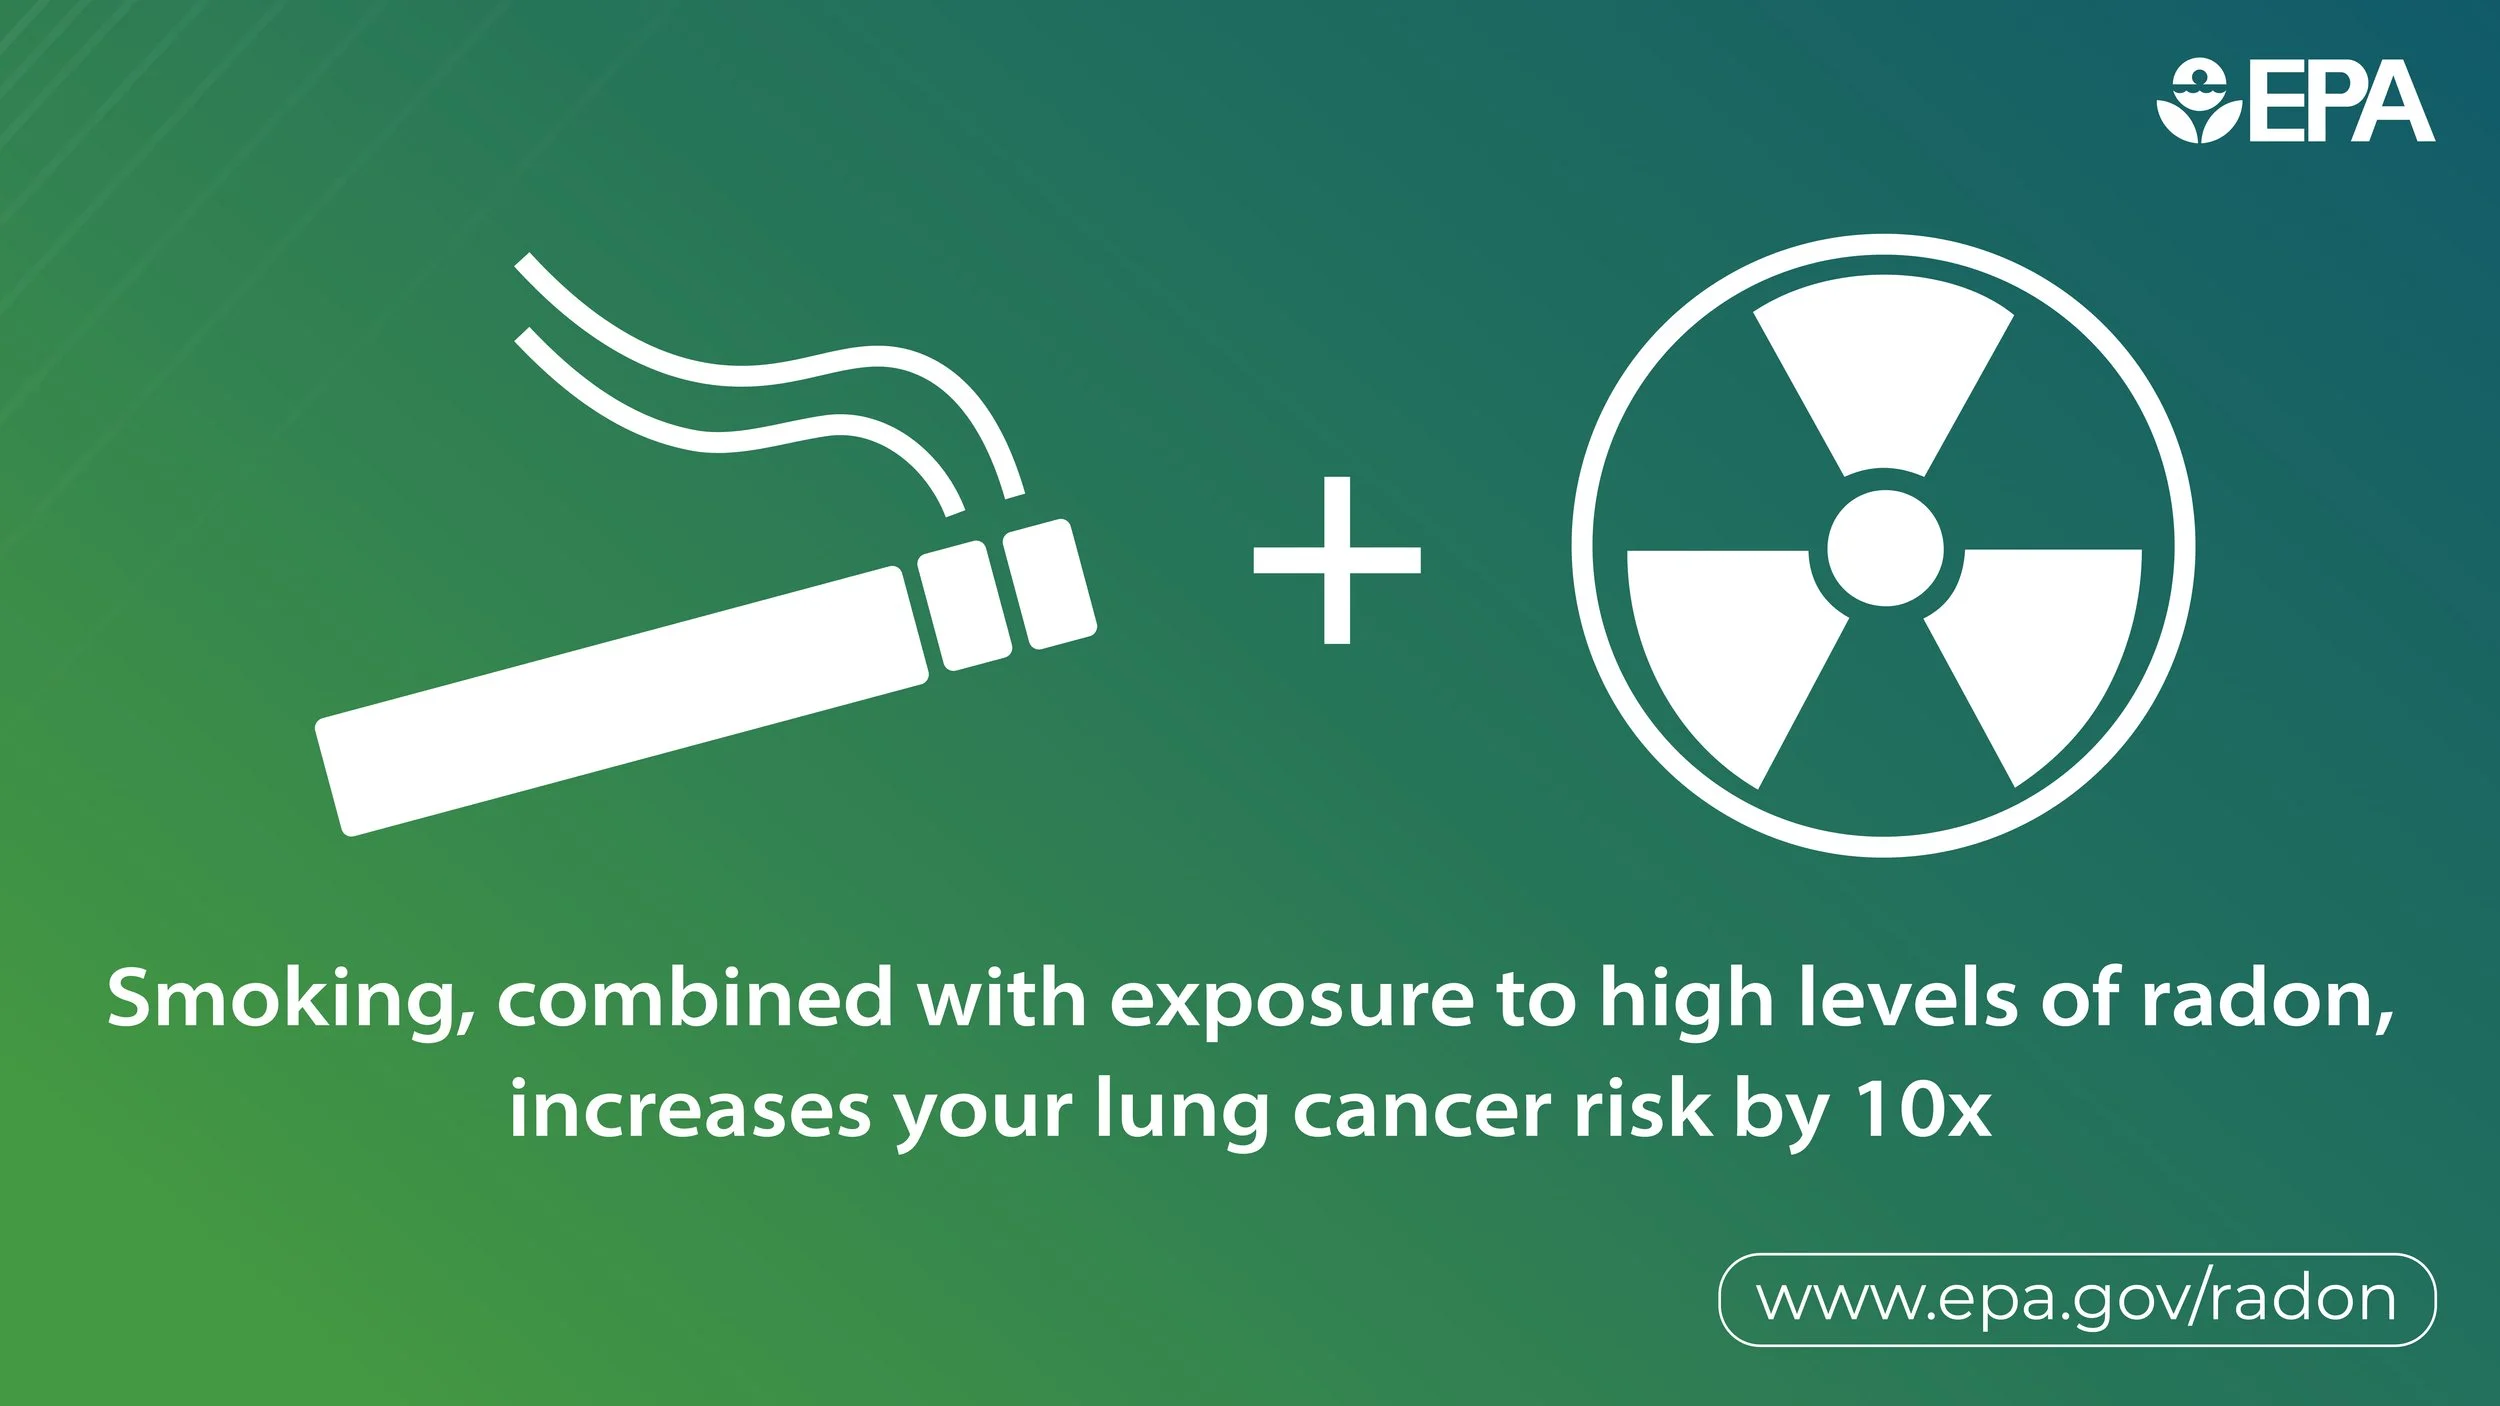
A graphic showing a lit cigarette next to a radiation warning symbol, indicating the health risks of smoking and radiation exposure, with a green background and EPA logo.
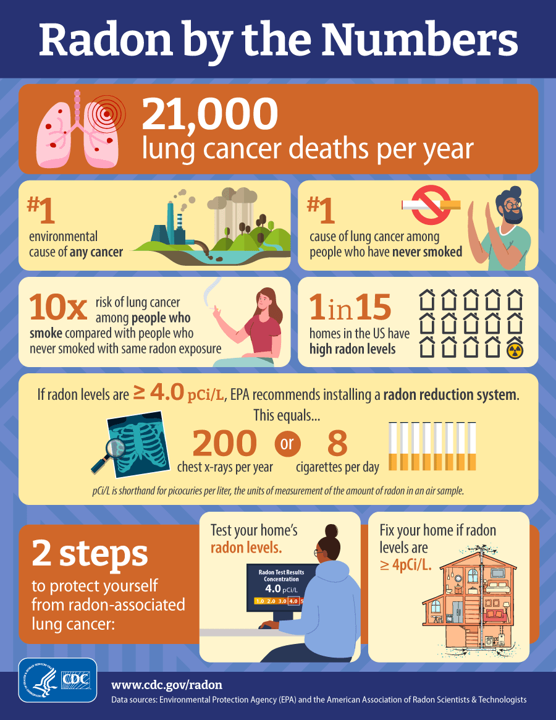
Infographic titled 'Radon by the Numbers' showing data on radon and lung cancer. Highlights include 21,000 lung cancer deaths annually, radon as the leading cause of lung cancer, and statistics on radon exposure and mitigation steps.
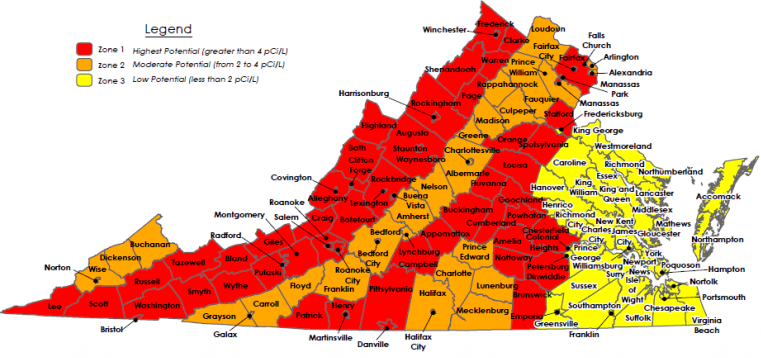
Map of Virginia with regions color-coded to show areas where different political candidates are popular. Red for Trump, yellow for McCain, and orange for other candidates. City and town names are labeled across the state.
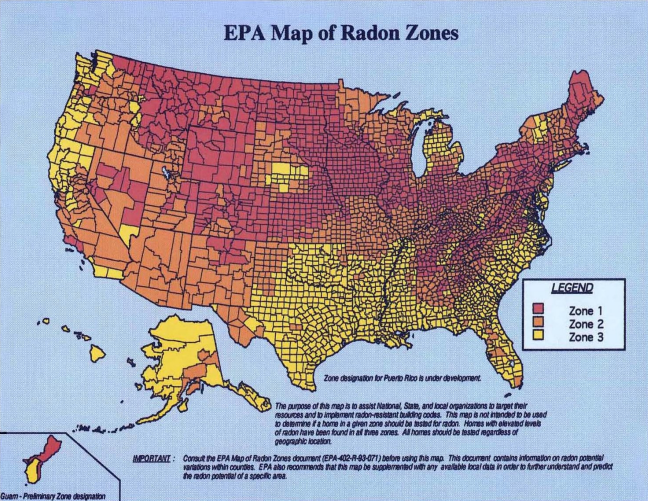
Map of the United States showing EPA Radon Zones, with Zone 1 in purple indicating high radon levels, Zone 2 in orange indicating moderate levels, and Zone 3 in yellow indicating low levels. The map includes a legend and a note about Puerto Rico.